Earthquake
2021年2月13日に発生した福島県沖の地震について (first report: 2021/02/14, last update: 2021/02/15)
Earthquake summary on 13th Feb., 2021, Off Fukushima prefecture, Japan
(注意)
下記内容は速報です.内容が修正・更新されることがあります.リロードしてからご覧下さい.
Notice: Following report will be updated. Please reload the Website prior to read it again.
1. 地震の概要 Summary of earthquake
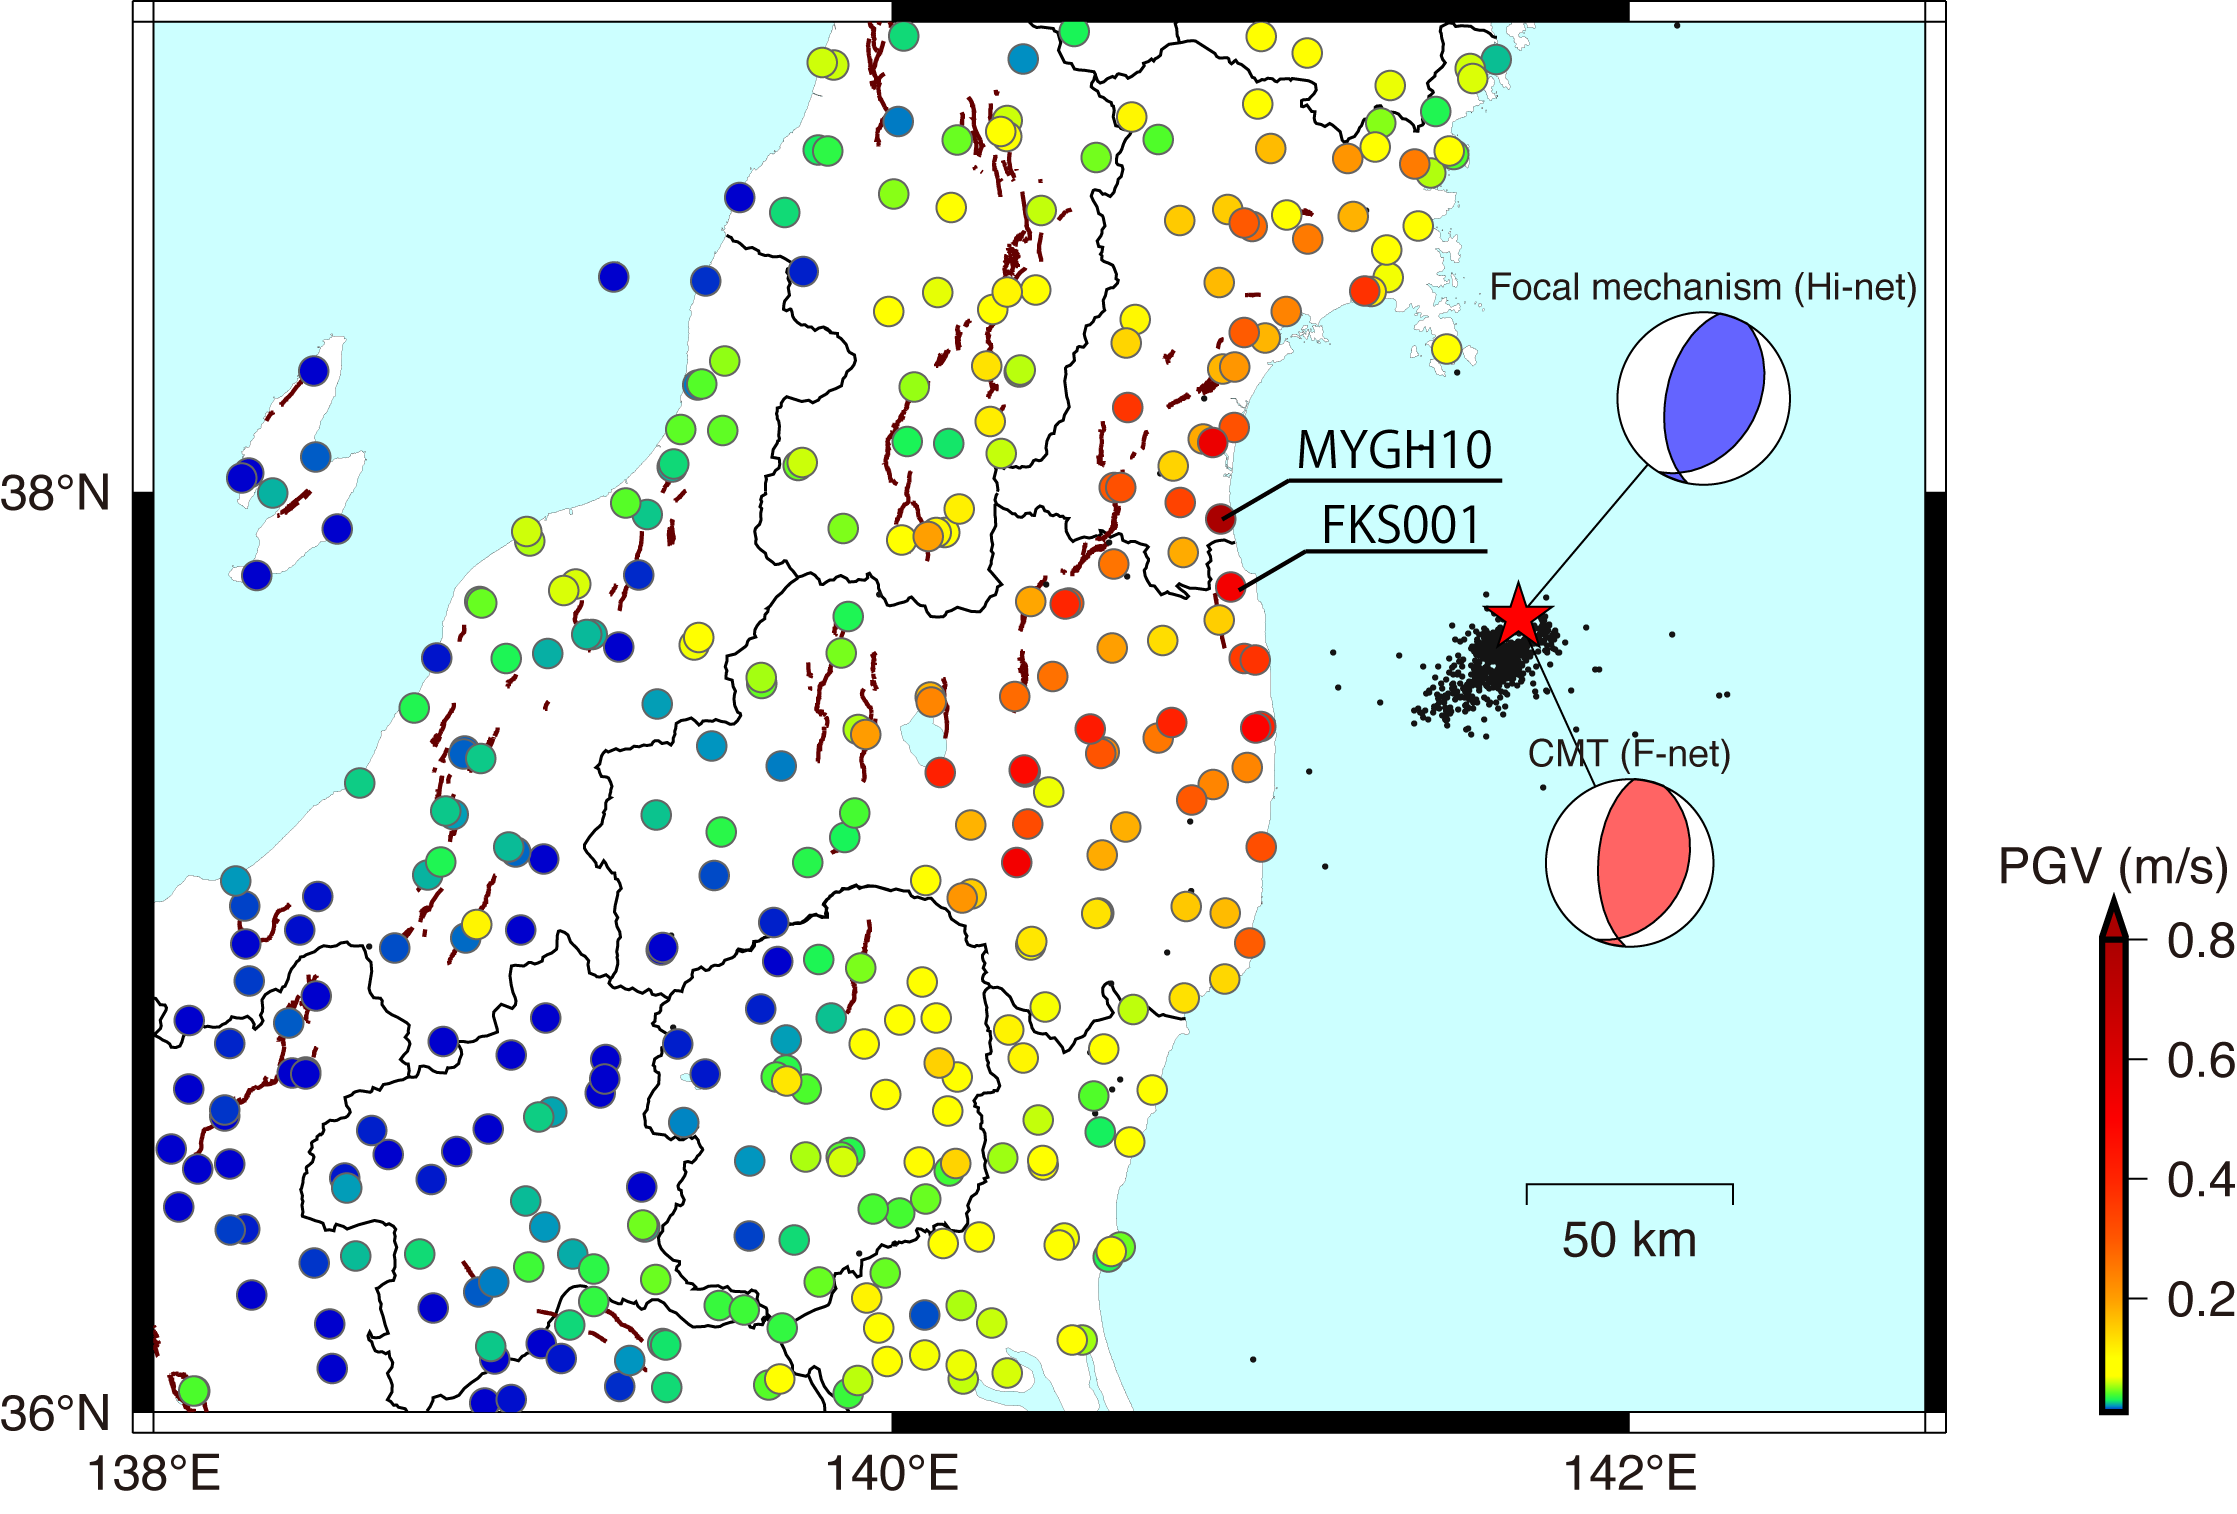
2021年2月13日 23時08分頃に福島県沖を震源とするMj7.3の地震が発生しました.震源深さは約60kmと推定されています.防災科学技術研究所のHi-netによる自動震源メカニズム解によると,東西方向に圧縮軸を持つ逆断層型地震であったことを示唆しています.本地震に関して気象庁は,2011年東北地方太平洋沖地震の余震であるとの見解を発表しています[1].国土地理院によると地震により生じた地殻変動は震源に近い地点で西向きに表れている[2]ため,東落ちの逆断層が活動したと考えられます.このことから本地震はプレート境界で発生した地震ではなく,沈み込む太平洋プレート内部(スラブ内)で発生した地震であると推察されます.
本地震では,宮城県蔵王町,福島県相馬市,国見町,新地町において震度6強が観測されました.地震による被害状況に関しては,土木学会地震工学委員会 地震被害調査小委員会のサイト[3],ならびに各機関から公開されている情報等[4,5]を参考にしてください.
A significant earthquake of Mj7.3 occurred off the coast of Fukushima Prefecture at 23:08 on February 13, 2021 at locat time (UTC: 14:08, Feb. 13). The depth of the epicenter is estimated to be about 60km. According to the automatic focal mechanism solution by Hi-net of the NIED, it was a reverse fault type earthquake with an east-west compression axis. The Japan Meteorological Agency (JMA) has announced that this earthquake is an aftershock of the 2011 off the Pacific coast of Tohoku Earthquake. According to the Geospatial Information Authority of Japan (GSI), the crustal movement caused by the earthquake was westward near the epicenter, suggesting that an east-dipping reverse fault was active. This suggests that the earthquake did not occur at a plate interface, but rather inside a subducting Pacific plate (in a slab).
The largest seismic intensity scale by JMA was 6+ recorded in Zao Town, Soma City, Kunimi Town, and Shinchi Town. For detail information on damage caused by earthquakes, please refer to the website of the committee on Earthquake Engineering, JSCE, as well as information published by relevant organizations.
2. 地震動の概要 Summary of ground motion
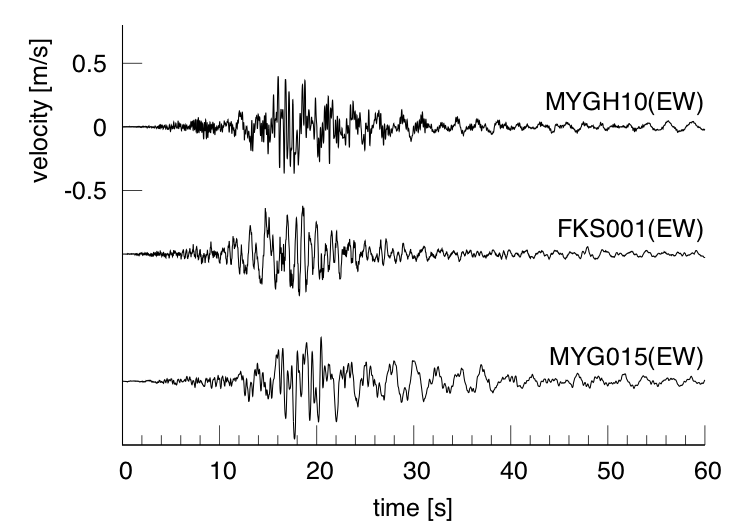
気象庁ならびに防災科学技術研究所強震観測網(K-NET,KiK-net)の代表的な記録について,速度波形と加速度応答スペクトル(減衰定数5%)を比較したものです.震度6強相当のKiK-net山元(MYGH10)では,最大加速度1.4g,最大速度0.8m/s程度の地震動が観測され,震度6弱を観測したK-NET岩沼(MYG015)およびK-NET相馬(FKS001)では,最大速度0.5m/s程度の地震動が観測されています.いずれも震源近くの観測点ですが,20-30秒程度の強い揺れが継続しています.震源より離れた地域では,より長い継続時間の地震動であったと考えられます.
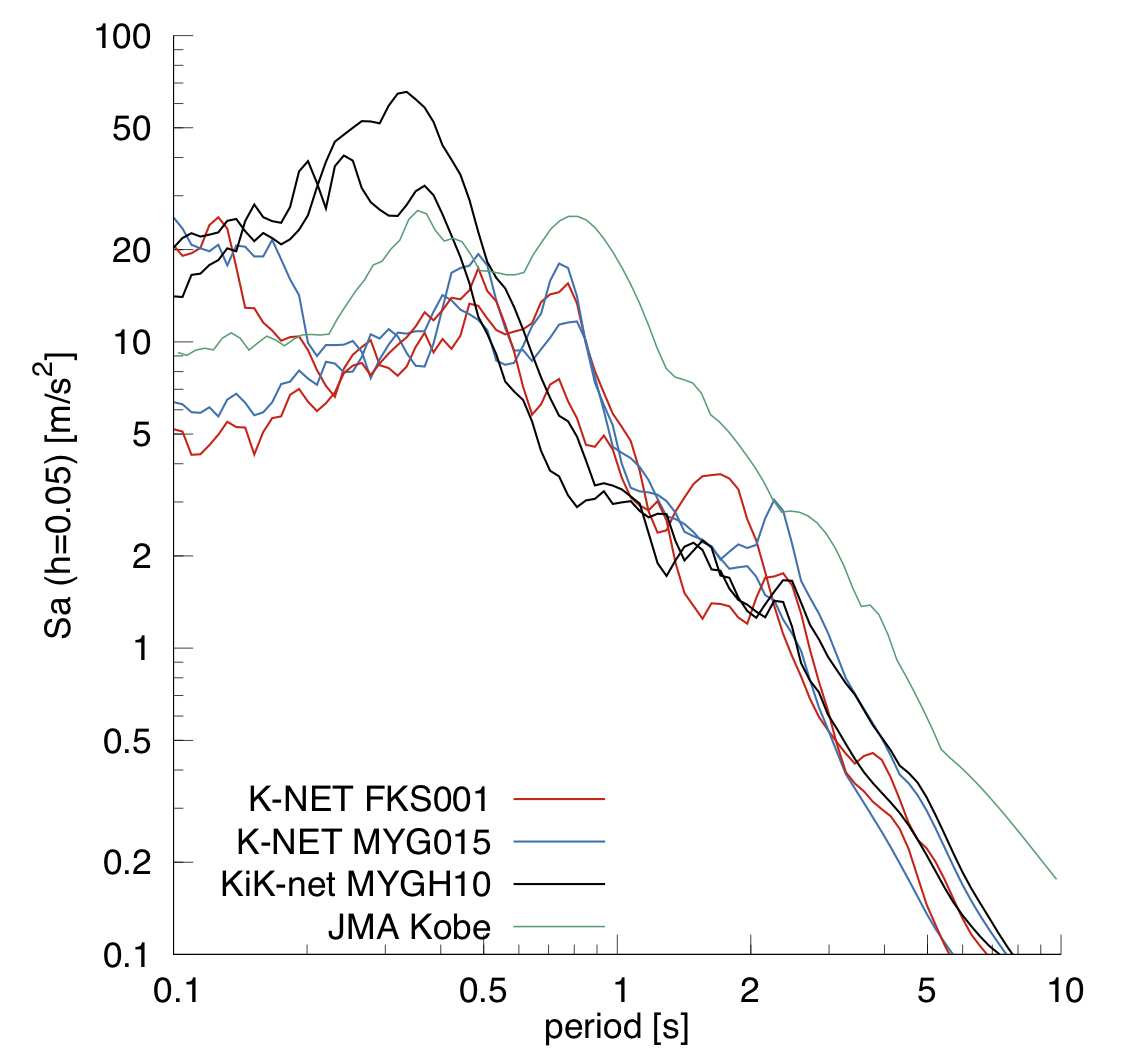
加速度応答スペクトルは,KiK-net山元(MYGH10)で0.3-0.4秒付近に強いピークを持つような形状を示しています.K-NET相馬(FKS001)やK-NET岩沼(MYG015)は0.5-0.8秒付近でピークを持つような形状です.0.5秒以上の周期帯域では過去の被害地震の記録であるJMA神戸記録(1995年兵庫県南部地震)と比較して小さな応答であるため,通常の構造物への影響は限定的であった可能性が考えられます.一方,斜面や付属物等の非構造部材への影響は無視できない程度の地震動であった可能性が考えられます.
The velocity waveforms and acceleration response spectra (5% damping constant) of representative records from the JMA and the NIED strong-motion observation networks (K-NET and KiK-net) are compared. At KiK-net Yamamoto (MYGH10), which had a seismic intensity about 6+, ground motions with PGA of 1.4g and PGV of 0.8 m/s were observed. At K-NET Iwanuma (MYG015) and K-NET Soma (FKS001), recording the seismic intensity was 6-, ground motions with PGV of about 0.5 m/s were observed. These sites are near the source, but the strong motions lasted for 20-30 seconds at least. In the area far from the source, the duration of the motion was longer.
The acceleration response spectra of KiK-net Yamamoto (MYGH10) show a shape with a peak aroun 0,3-0.4 seconds, and those of K-NET Iwanuma (MYG015) and K-NET Soma (FKS001) show a shape with a peak around 0.5-0.8 seconds. The responses more than 0.5 seconds are small compared to the JMA Kobe record (1995 Kobe earthquake), which is the record of past damage earthquakes. The impact on normal structures might be limited. On the other hand, the effects on non-structural components and slopes may not be negligible.

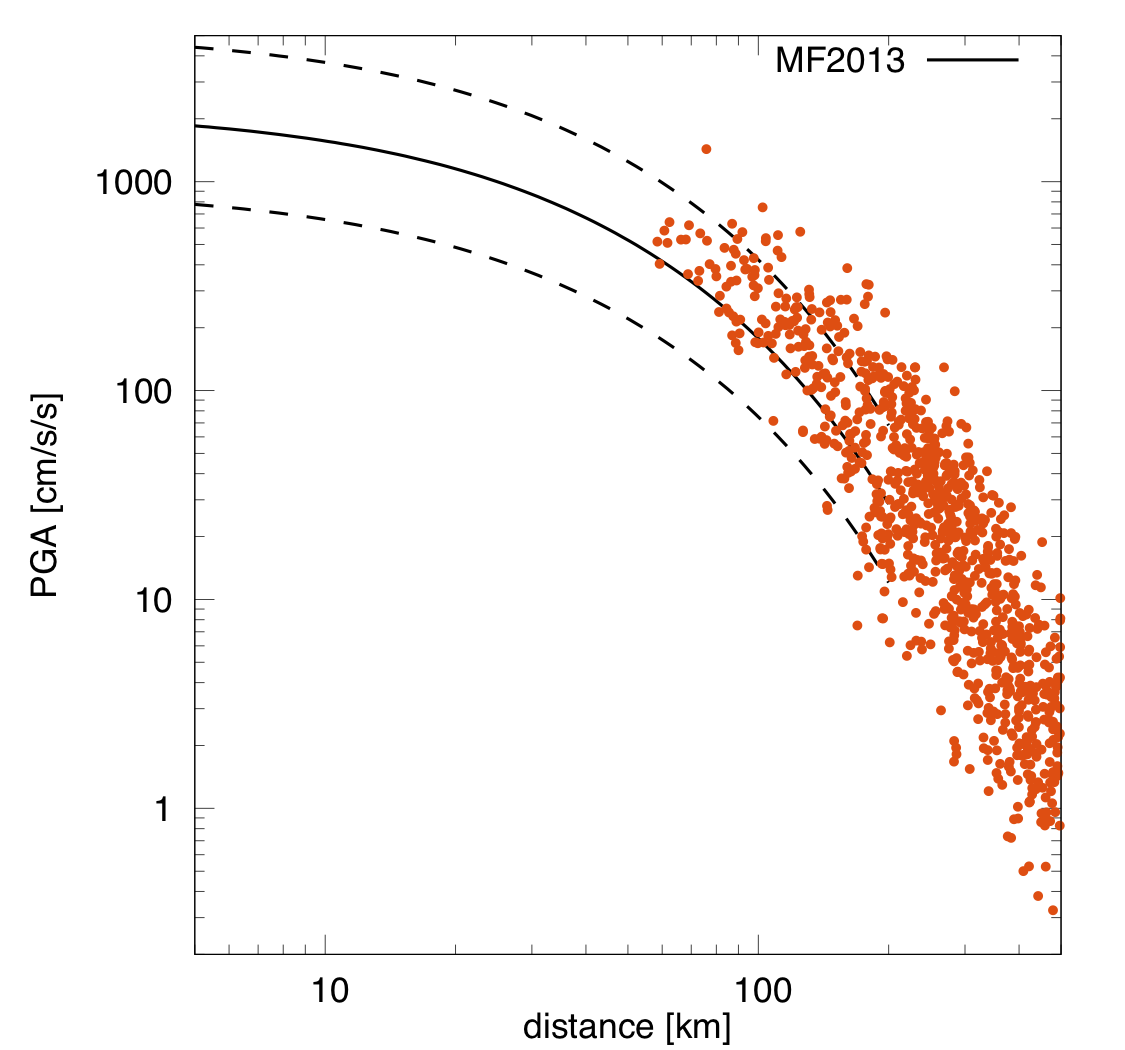
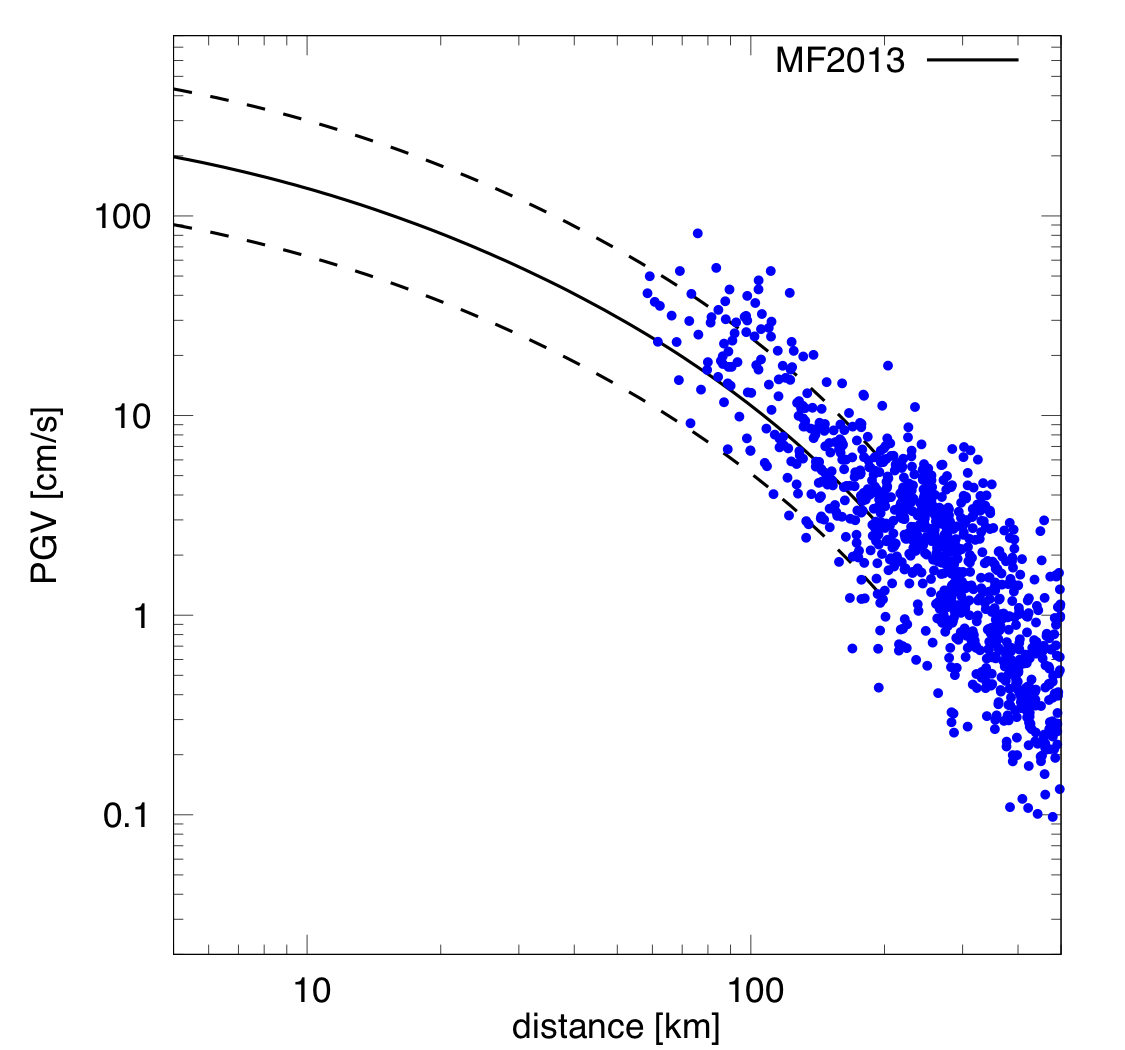
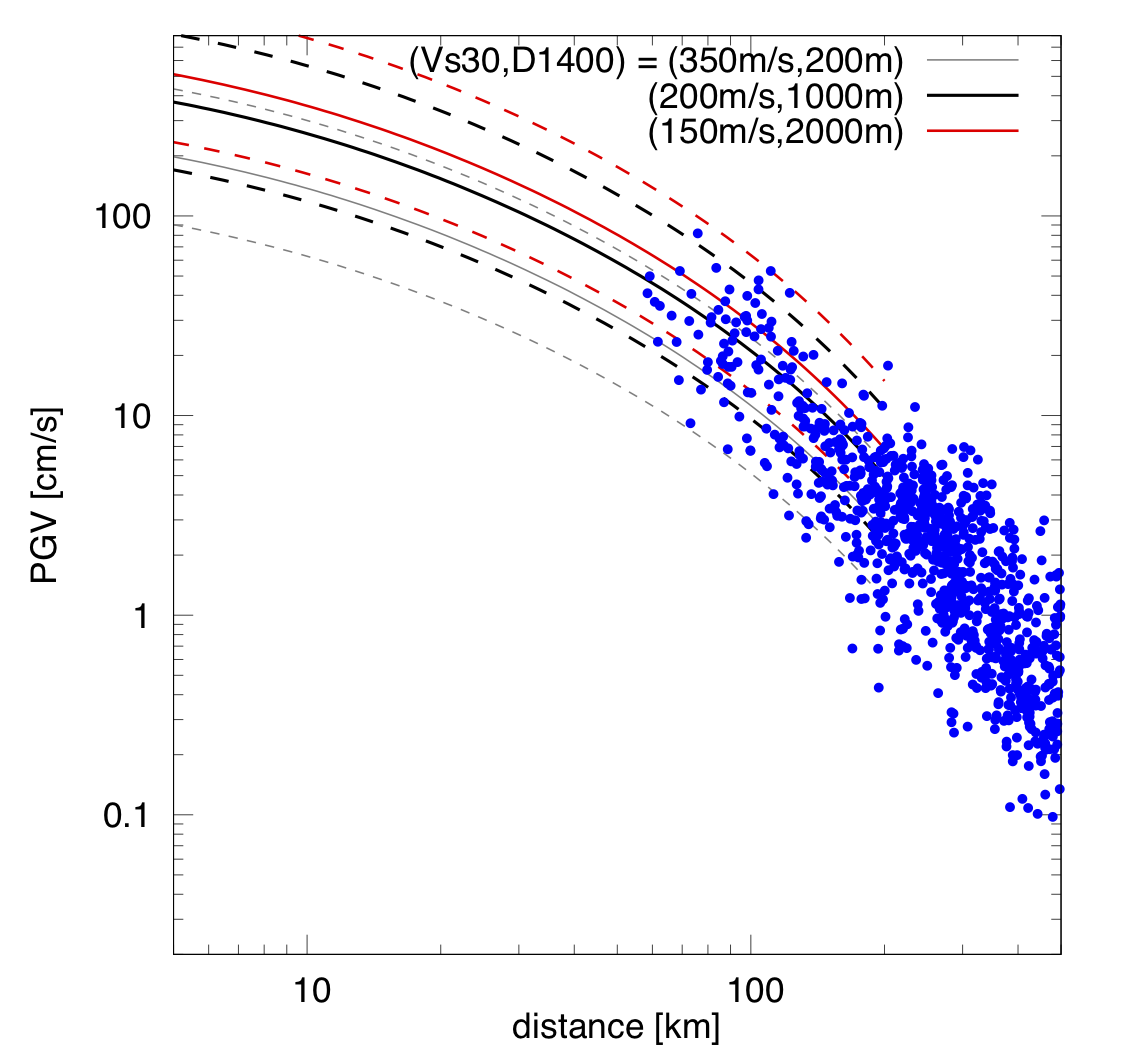
下図は,各地で観測された最大加速度と最大速度を断層距離で整理したものです.断層からの距離に従って揺れの強さが減少する傾向は,マグニチュードや地震の発生位置など様々な要因によって決まります.ここでは,近年の地震データを使って求められたMorikawa and Fujiwara (2013)[6]の式と比較しています(注:火山フロントの補正は入れていません.標準ケースをVs30=350m/s,D1400=250mとしています).スラブ内地震という条件の下で経験的に知られていた曲線と概ね調和的であることが見て取れます.最大加速度や最大速度の平均的な減衰特性,すなわち揺れの広がり具合はこれまでに経験してきたスラブ内地震の特徴と概ね一致することを示しています.ただし,場所によって揺れの大きさは異なりますので,ここの地点の揺れやすさが標準であったことを言うものではありません.
The figure below shows the maximum acceleration and velocity observed at various locations, plotted by fault distance. The intensity of shaking decreases with distance from the fault, which is determined by various factors such as magnitudes and earthquake types. Here, the data are compared with the equation by Morikawa and Fujiwara (2013) (note: the correction factor for the volcanic front is not included here; the standard case is assumed Vs30=350m/s and D1400=250m). The data are consistent with the curves empirically known under the condition of in-slab earthquakes. This suugests that the average characteristics of the aattenuation, i.e., the spatial distribution of PGA and PGV, are consistent with the characteristics of in-slab earthquakes that we have experienced. Notice that amplitudes of the values depends on the sites.
謝辞 Acknowledgment
本報告では,気象庁ならびに防災科学技術研究所の強震記録を使用致しました.記して感謝致します.
In this report, I used strong ground motion records of JMA and NIED. I appreciate for the efforts.
参考文献 References
[1] 気象庁:令和3年2月13日23時08分頃の福島県沖の地震について.Link
[2] 国土地理院:令和3年2月13日23時07分の福島県沖の地震に伴う地殻変動.Link
[3] 土木学会地震工学委員会 地震被害調査小委員会:2021年2月13日 福島・宮城で発生した地震.Link
[4] 国土交通省:福島県沖を震源とする地震について.Link
[5] 東北地方整備局:福島県沖を震源とする地震(最大震度6強)に伴う防災情報 東北地方整備局に関連する情報一覧.Link
[6] Morikawa and Fujiwara: A new ground motion prediction equation for Japan applicable up to M9 Mega-earthquake, JDR, 8(5), 878-888, 2013.
文責 後藤浩之 (Hiroyuki Goto)(京都大学防災研究所 DPRI Kyoto University)