Earthquake
2022年3月16日に発生した福島県沖の地震について (first report: 2022/03/17, last update: 2022/03/31)
Earthquake summary on 16 March, 2022, Fukushima, Japan
(注意)
下記内容は速報です.内容が修正・更新されることがあります.リロードしてからご覧下さい.
Notice: Following report will be updated. Please reload the Website prior to read it again.
(New) 被害調査報告はこちら Preliminary report of damage investigation
1. 地震の概要 Summary of earthquake
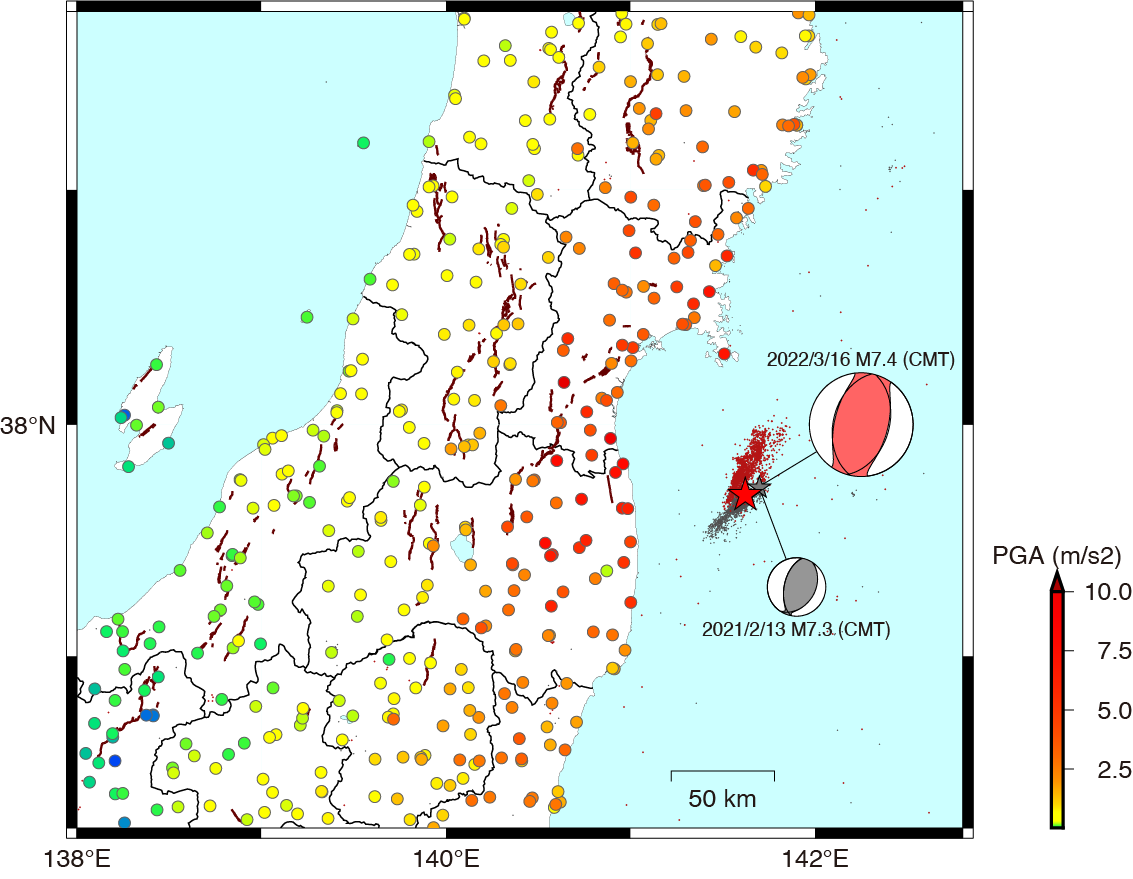
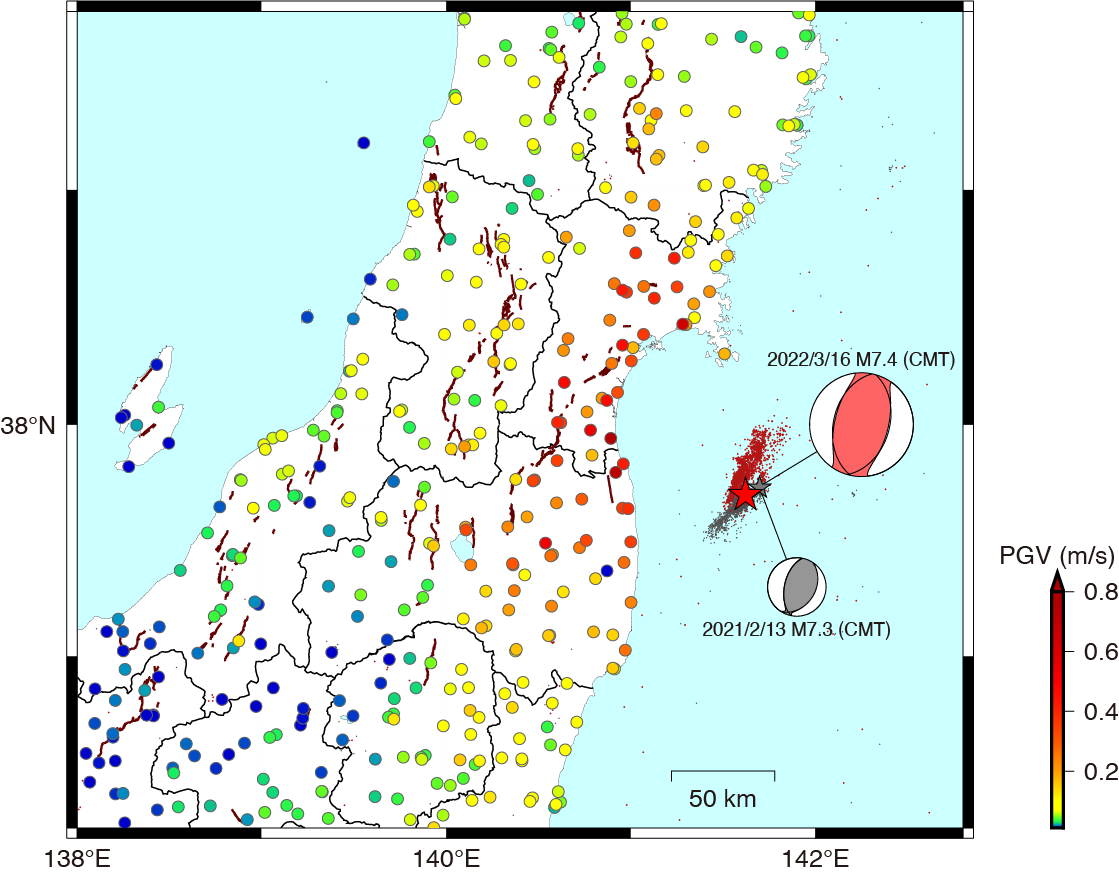
2022年3月16日23時36分頃に福島県沖を震源とするMj7.4(Mw7.3)の地震が発生しました.震源深さは57kmと推定されています[1].気象庁による発震機構解によると東西方向に圧縮軸を持つ逆断層地震であったことが示唆され[2],余震の発生状況や地殻変動データにより東落ちの逆断層であることや震源深さ等から太平洋プレート内部で発生した地震(スラブ内地震)であると考えられます[3].本地震のメカニズム解と震源深さは 2021年2月に発生した地震 と似ており,2021年2月の地震も同様にスラブ内地震と考えられています.今回の地震は,2021年2月の地震に比べて北側に余震が広がっていることから異なる断層が破壊したことが示唆されるとともに,震源の北側により揺れの強いエリアが広がったものと考えられます.
本地震では宮城県の登米市,蔵王町,福島県の相馬市,南相馬市,国見町で最大となる震度6強を観測し,東北地方において広く震度5弱以上を観測しました[4].この地震では,大規模な停電の発生,および東北新幹線の脱線が発生するなど,インフラ施設等への地震の影響が見られます.具体的な被害状況に関しては,土木学会地震工学委員会 地震被害調査小委員会のサイト[5],同被害調査報告会の資料[6],ならびに各機関から公開されている情報[7,8]等を参考にしてください.
An earthquake of Mj7.4 (Mw7.3) occurred at 23:36 on 16 March 2022 at local time (UTC: 14:36, 16 March), with the epicenter in the off Fukushima prefecture, Japan. The depth of the hypocenter is estimated to be about 57 km. According to the CMT solution by JMA, it was a reverse fault with an east-west compression axis. Based on the aftershock distribution and crustal deformation (GNSS) data, it is considered to be an eastern dipping fault. In addition, the depth and other factors suggest that the earthquake occurred inside the Pacific Plate (an intra-slab earthquake)[3]. The focal mechanism and hypocenter depth of this earthquake are similar to those of the February 2021 earthquake, and the 2021 earthquake is also considered to be an intra-slab earthquake. The aftershocks of this earthquake were more spread to the north than those of the 2021 earthquake, suggesting that a different fault plane ruptured and that the area of stronger ground motions was extended to the north of the epicenter.
The largest seismic intensity scale by JMA was 6+ recorded in Miyagi and Fukushima prefectures[4]. The earthquake caused a power outage in a wide area and the derailment of the Tohoku Shinkansen bullet train. For other specific damage information, please refer to the website of the committee on Earthquake Engineering, JSCE[5], reports of briefing sessions[6], as well as information published by relevant organizations[7,8].
2. 地震動の概要 Summary of ground motion
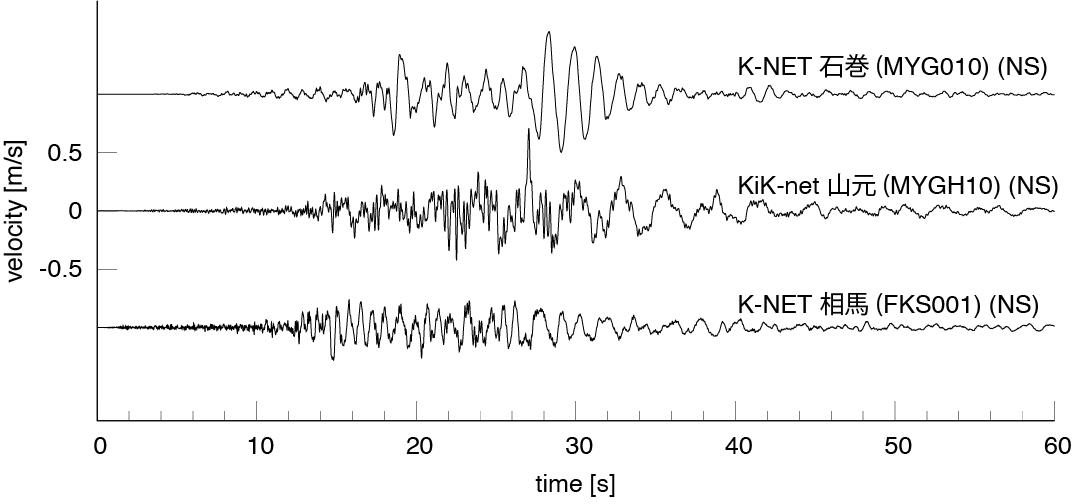
防災科学技術研究所強震観測網(K-NET,KiK-net)の代表的な記録について,速度波形と加速度応答スペクトル(減衰定数5%)を比較しました.K-NET相馬(FKS001)では,最大加速度7.44m/s2,最大速度0.72m/s,震度6強(6.17)の地震動が観測され,KiK-net山元(MYGH10),K-NET石巻(MYG010)ではそれぞれ最大速度0.76m/s,最大速度0.64m/sの地震動が観測されました.K-NET相馬(FKS001)では東西成分の振幅が大きいですが,KiK-net山元(MYGH10)やK-NET石巻(MYG010)では顕著な違いは見られません.10秒ほどの時間間隔で明瞭な2つの波群が見られる波形もあります.
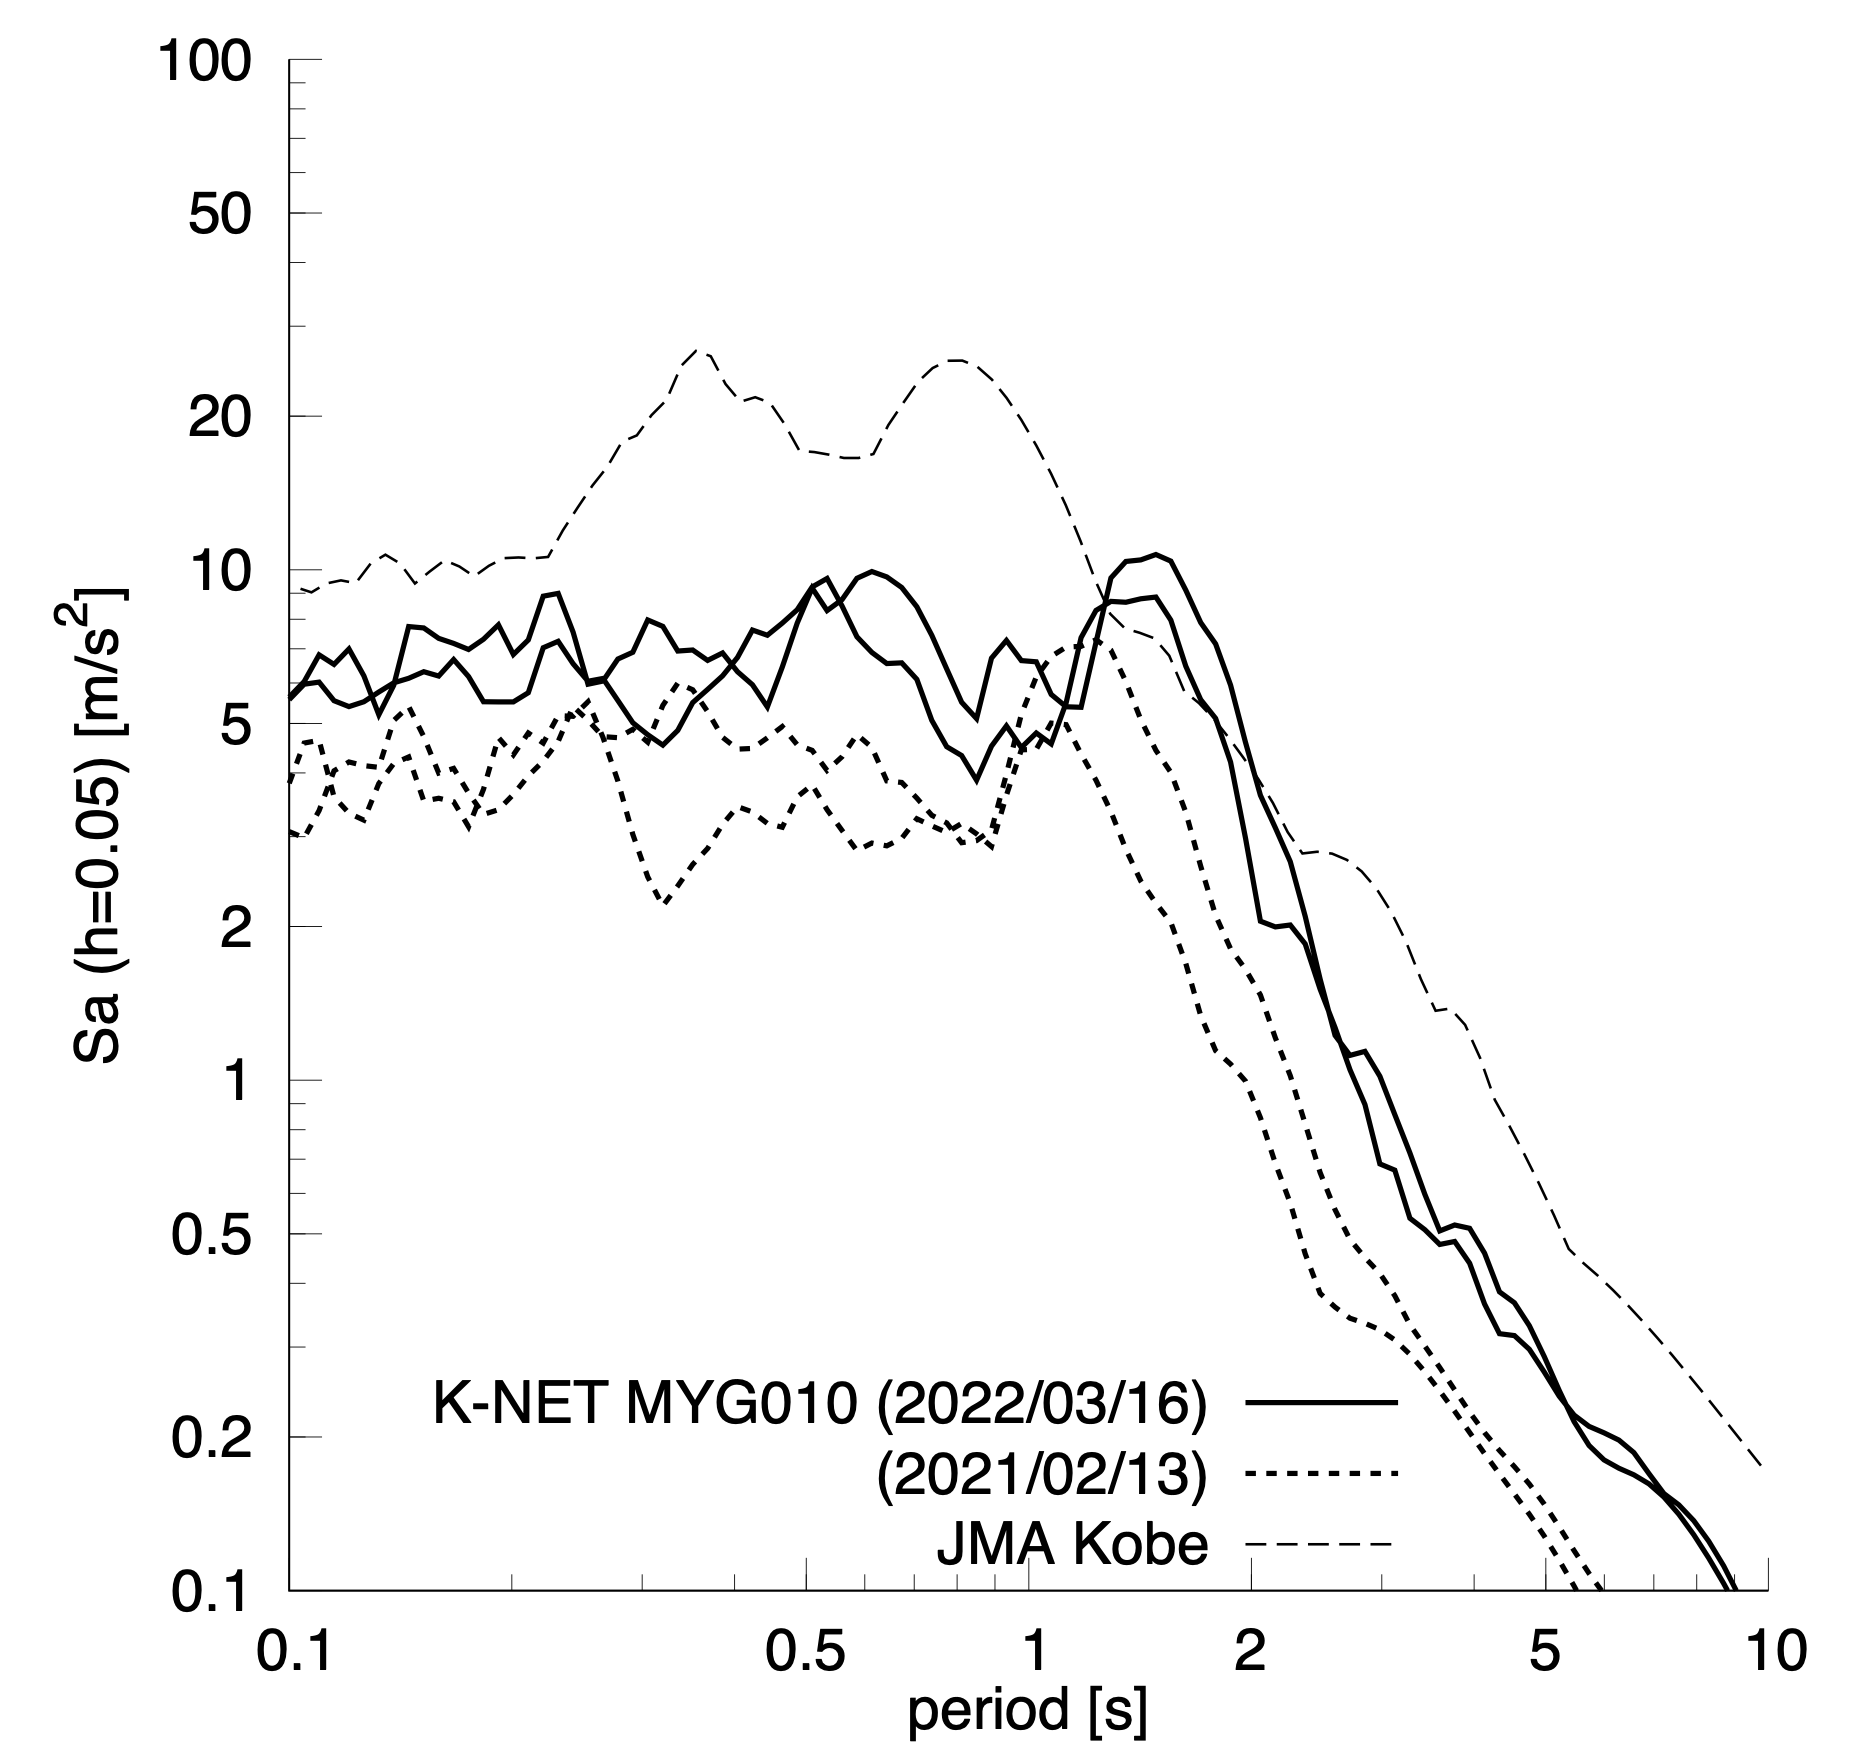
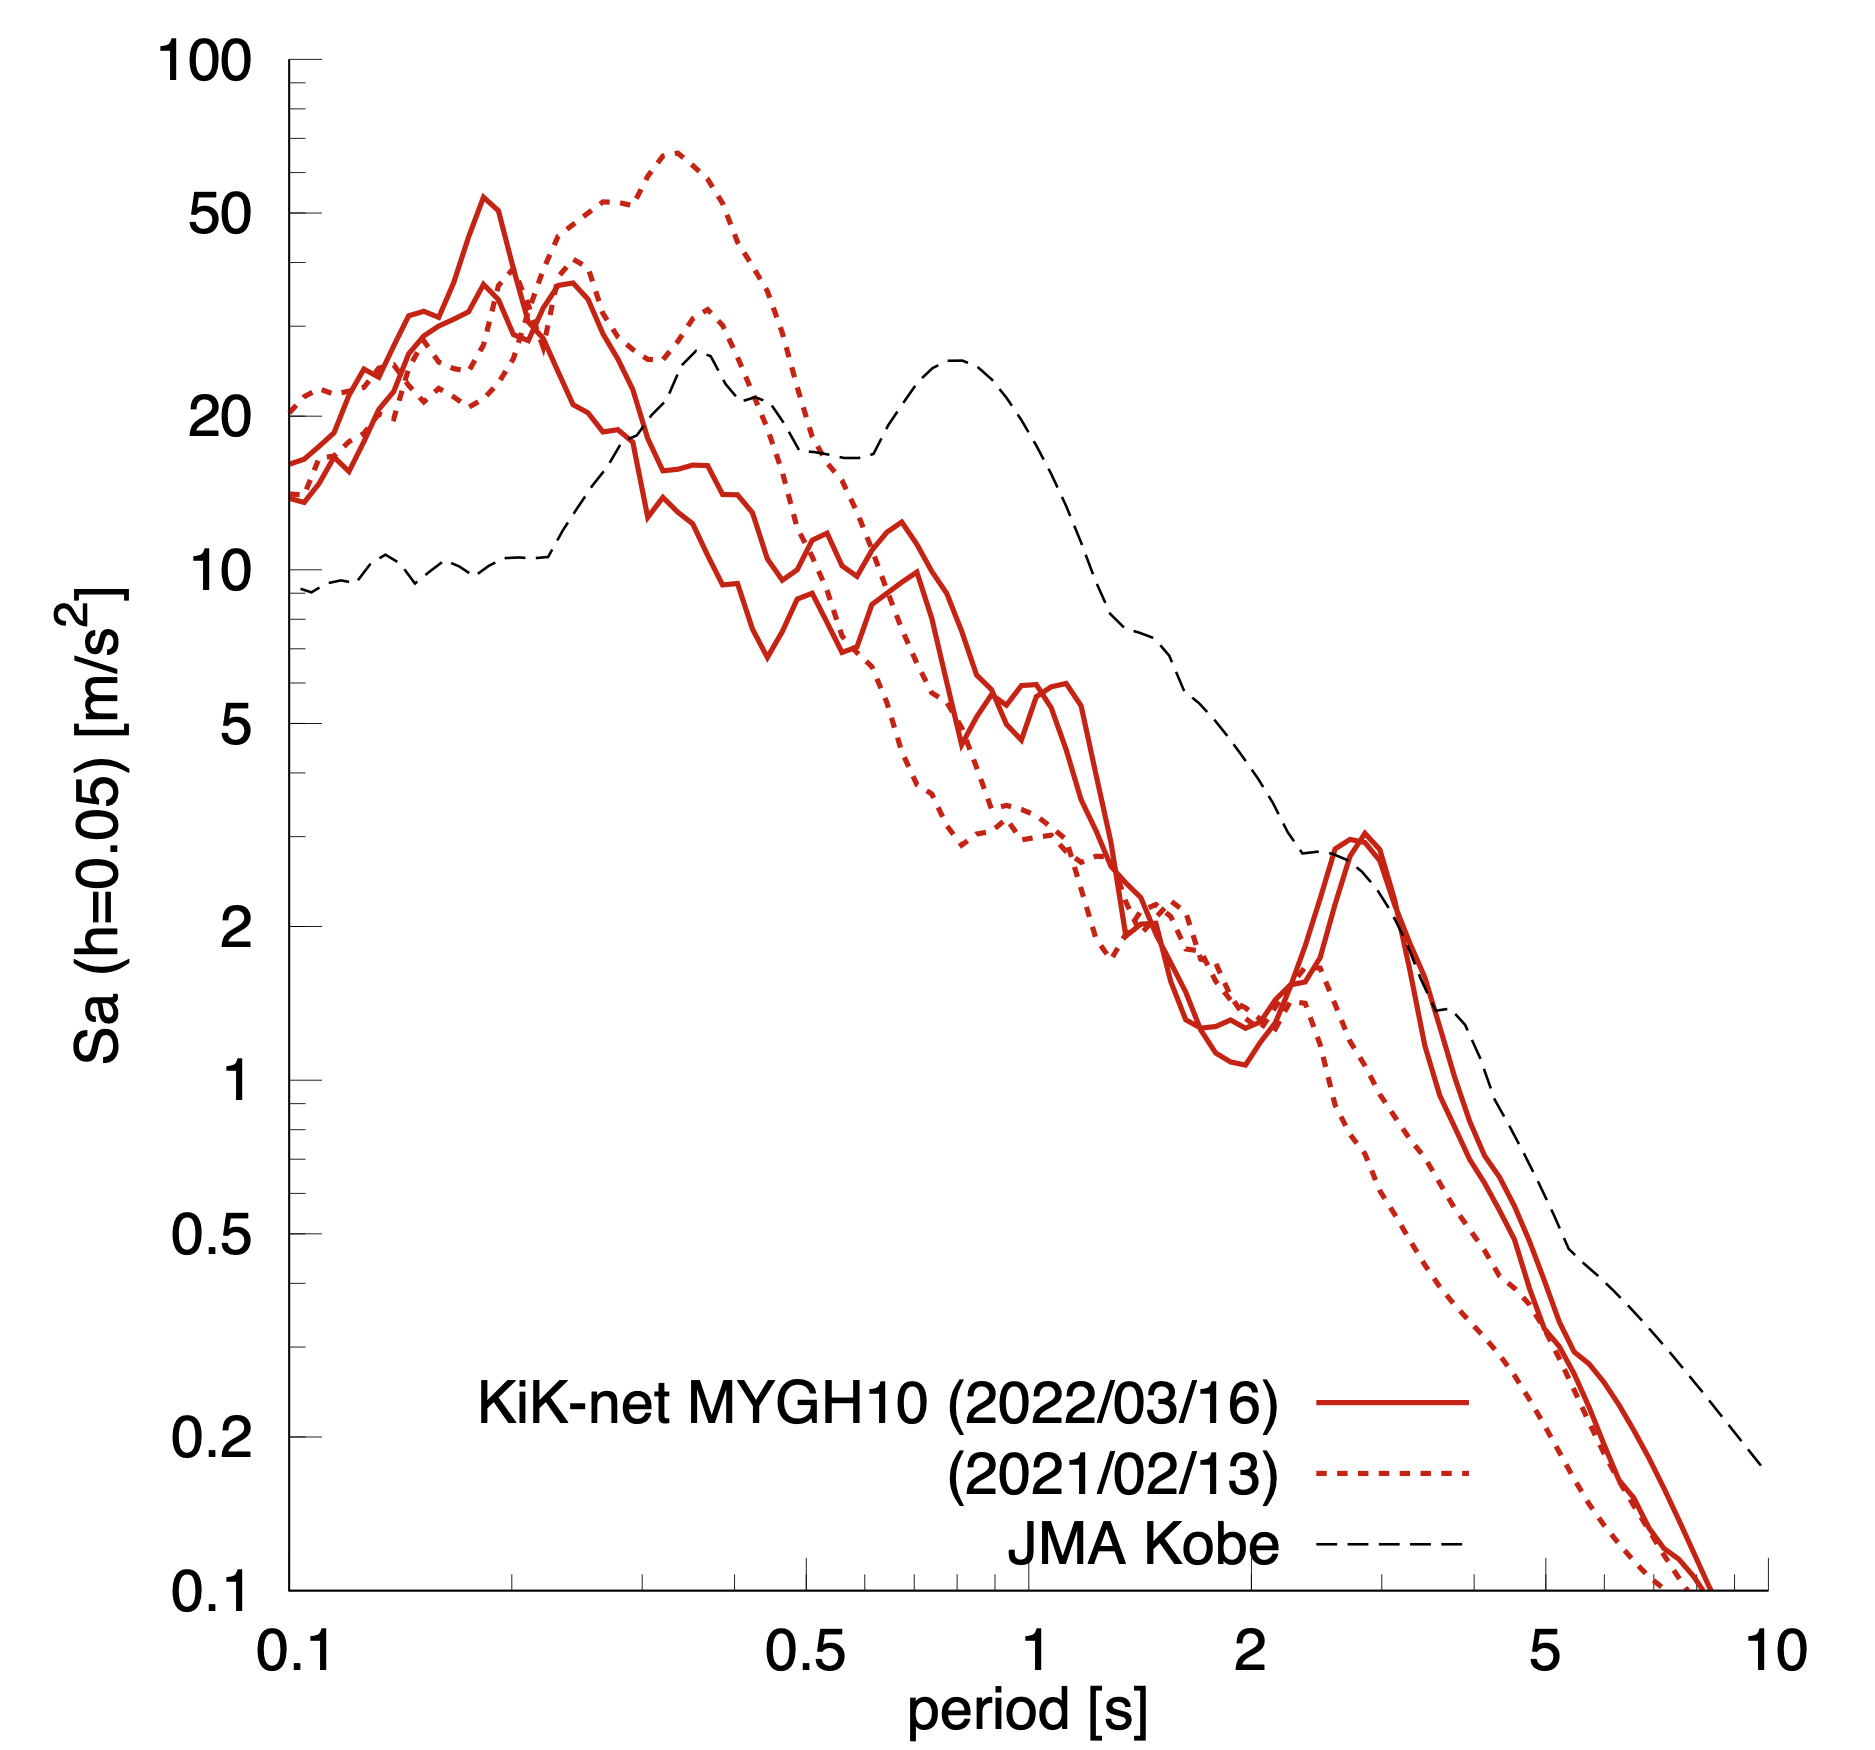
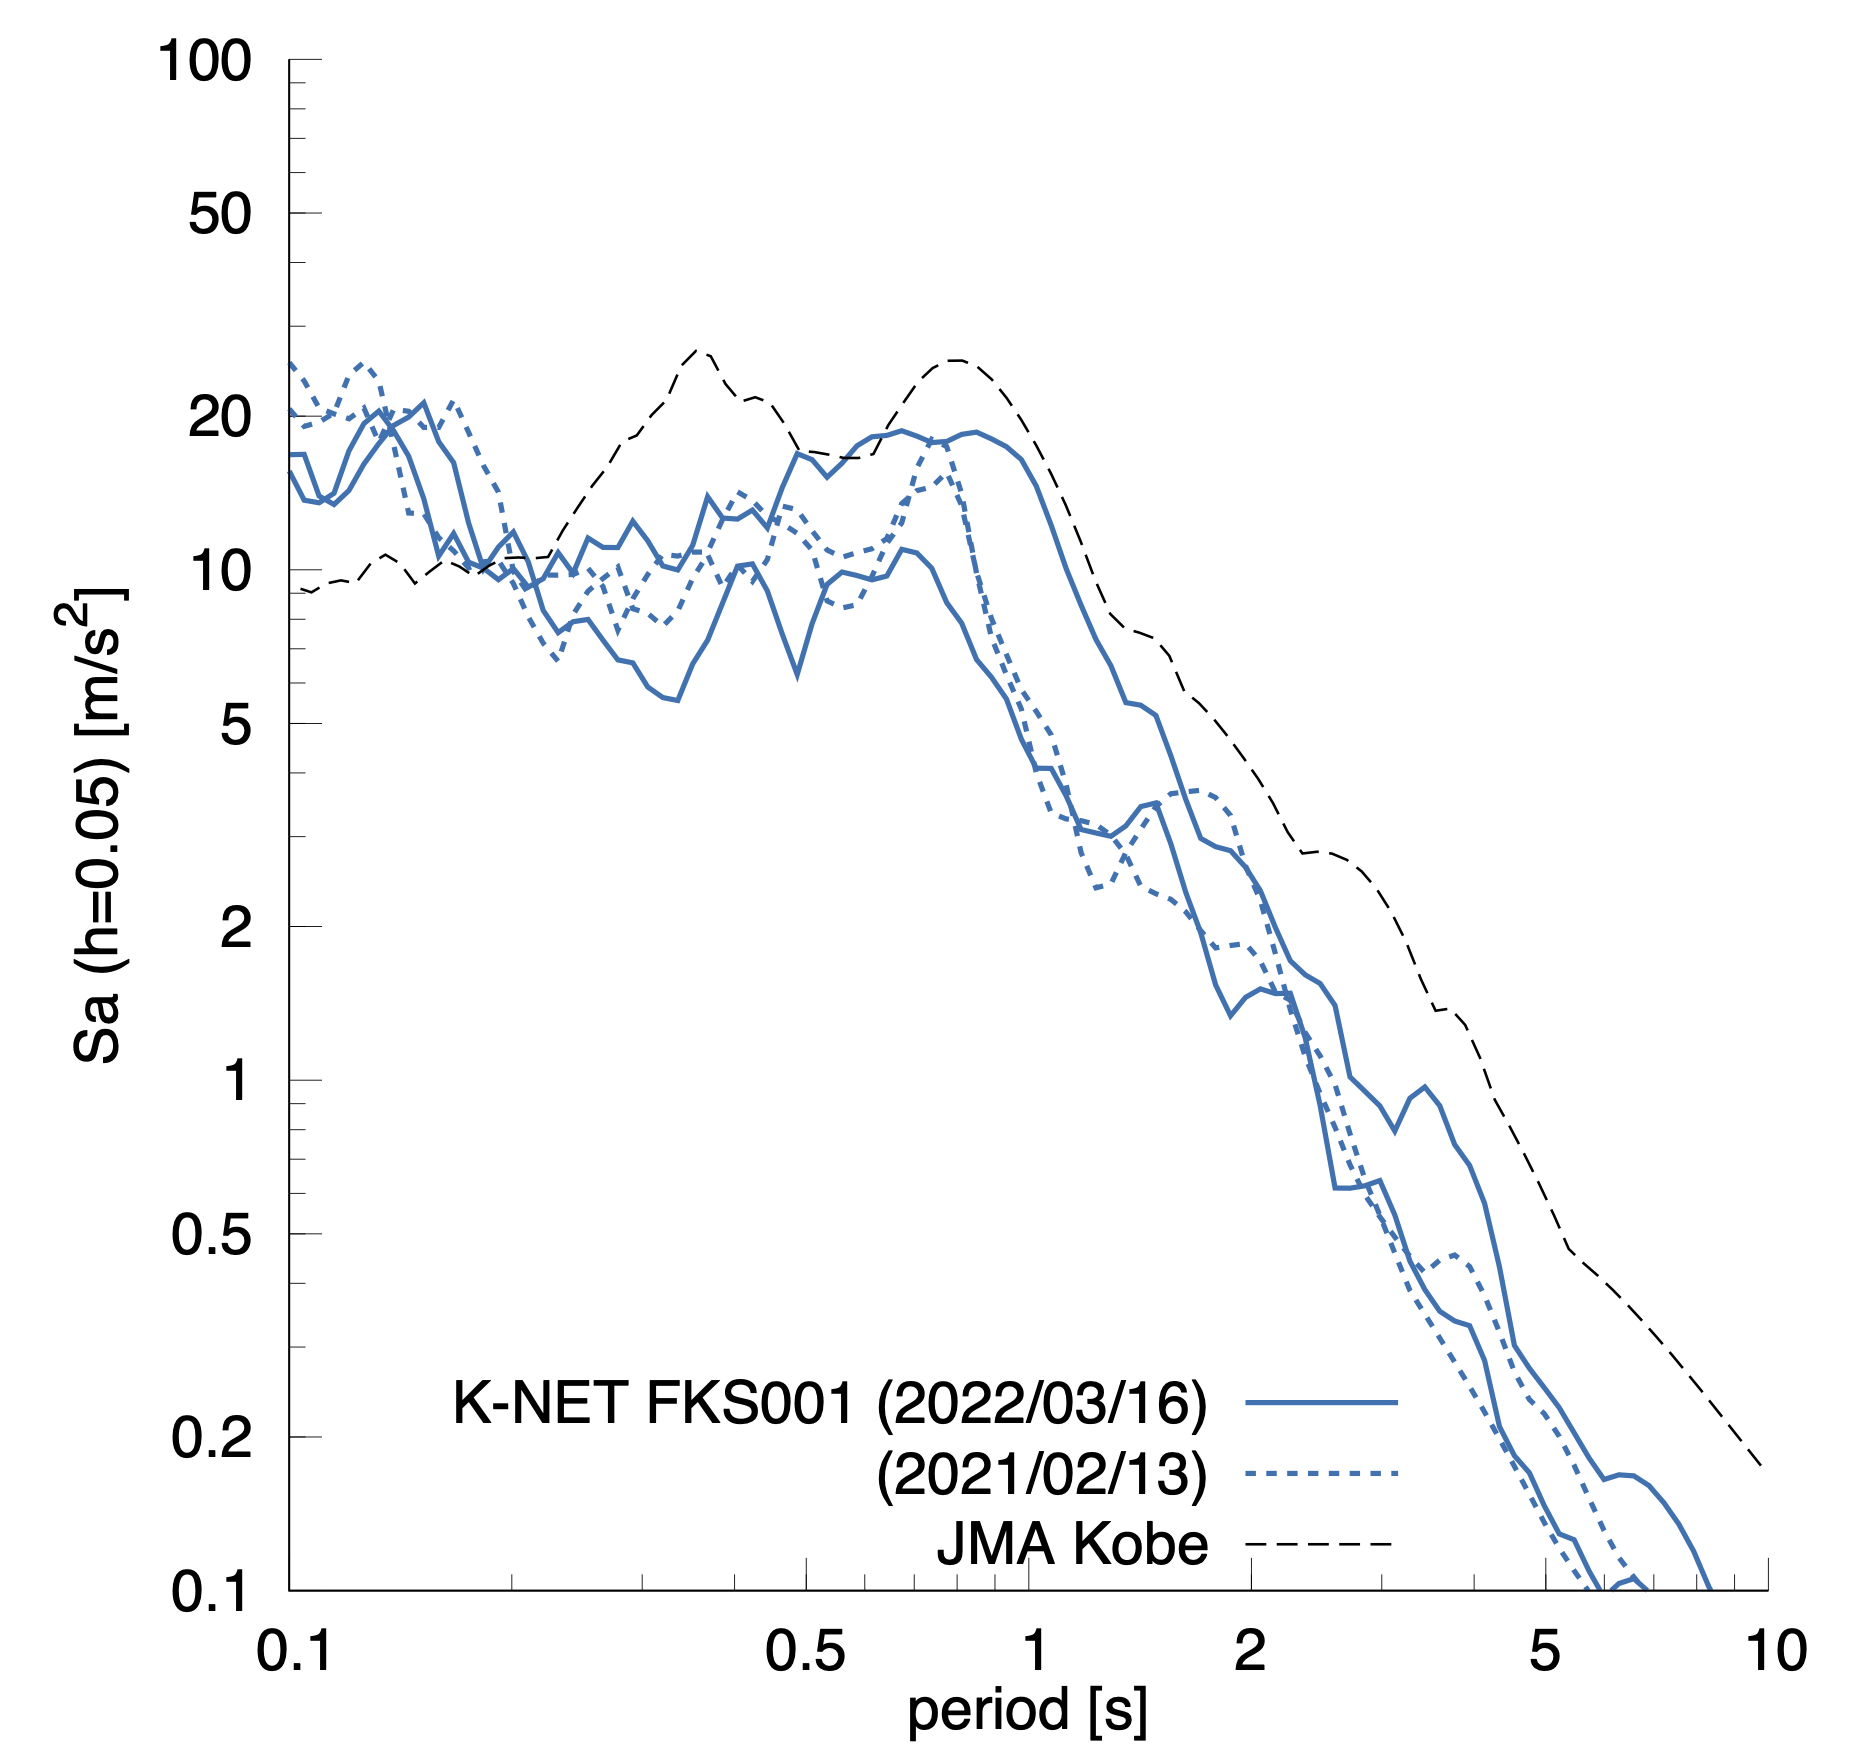
加速度応答スペクトルは地震観測点によって異なる形状を示しています.K-NET相馬(FKS001)では0.8秒付近にピークを持つような形状を示しているのに対し,KiK-net山元(MYGH10)では0.2秒ほどに,K-NET石巻(MYG010)では1.5秒ほどにピークが見られます.このため,地震そのものの周期特性を端的にまとめて述べることは容易ではないようです.一方,2021年2月の地震と比較すると,いずれも2つの地震のスペクトル形状は似ており,周期0.5-1.0秒の範囲では共通して2021年2月を上回る地震動であったことが示唆されます.加えて,K-NET石巻(MYG010)では2021年よりもやや長周期寄りで大きな応答を示していること,K-NET相馬(FKS001)の東西成分は2021年よりも大きな応答を示しています.これらは上述したように震源断層の位置やその破壊様式が異なることによると考えられるので,より詳細な議論が必要です.
Velocity waveforms and acceleration response spectra (damping constant 5%) of representative records from the NIED strong-motion observation networks (K-NET and KiK-net) were compared. At K-NET Soma (FKS001), ground motion with PGA 7.44m/s2 and PGV 0.72m/s with a seismic intensity 6+(6.17) were observed. PGVs 0.76m/s and 0.64m/s were observed at KiK-net Yamamoto (MYGH10) and K-NET Ishinomaki (MYG010), respectively. The amplitude of the east-west component is large at K-NET Soma (FKS001), but no significant difference is seen at KiK-net Yamamoto (MYGH10) or K-NET Ishinomaki (MYG010). Two distinct wave packets can be seen with a time interval of about 10 seconds.
The acceleration response spectra show different shapes depending on the seismic stations: K-NET Soma (FKS001) shows a peak of around 0.8 seconds, while KiK-net Yamamoto (MYGH10) shows a peak of around 0.2 seconds and K-NET Ishinomaki (MYG010) shows a peak of around 1.5 seconds. On the other hand, compared to the 2021 earthquake, the spectral shapes of the two earthquakes are quite similar: K-NET Ishinomaki (MYG010) shows a larger response with a slightly longer period than the 2021 earthquake, and the east-west component of K-NET Soma (FKS001) is larger than the 2021 earthquake. As mentioned above, these are indications of the different locations of the source faults and their rupture patterns. It requires a more detailed discussion.


周期0.5-1.0秒の地震動レベルを2021年2月の地震と比較するため,各地の記録について水平動のスペクトル比をとり周期0.5-1.0秒の平均的な振幅倍率を図示しました.福島県北部より北側では全体的に2倍以上の振幅倍率であり,対して南側では2倍に満たないことがわかります.このことから,福島県北部より北側では,2021年2月よりも強い揺れに見舞われたと考えることができます.これは,地震の規模の違いによる影響も考えられますが,地震モーメントの比率から見積もられる理論的な倍率(1.33〜2.34倍)より高い地点もあることや,周期0.5-1.0秒は長周期側の理論倍率(2.34倍)を適用するには周期が短い可能性が考えられるため,今後詳細な検討が必要です.
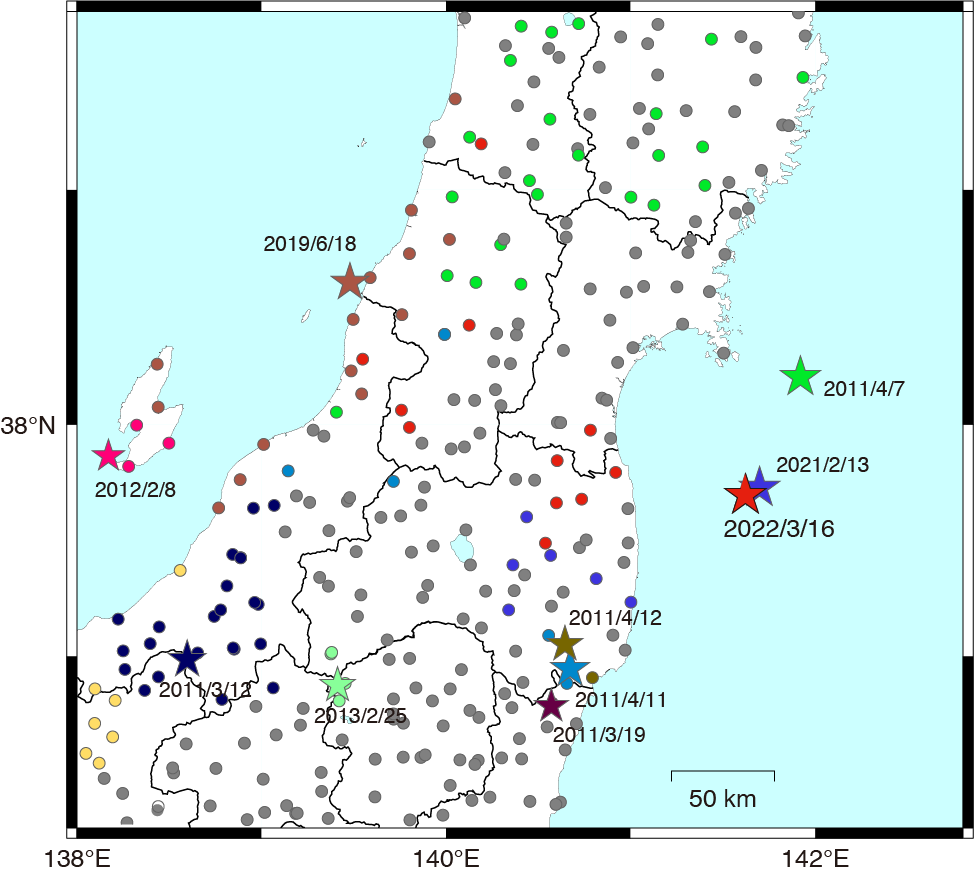
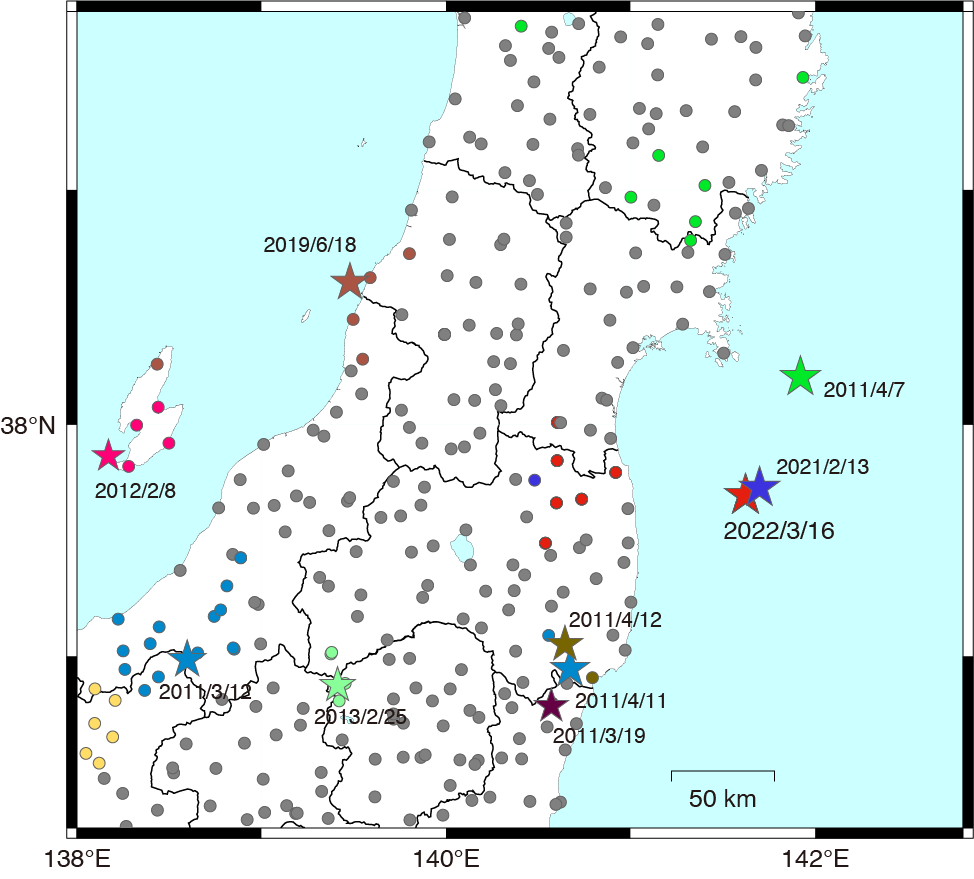
2011年東北地方太平洋沖地震を含む2011年以降の地震について,各地で最大となる地震動を観測した地震を整理しました.加速度応答スペクトルの周期0.5-1.0平均,周期1.0-2.0平均の値でそれぞれ比較し,図中に色分けして示しています.図中にグレーで示される地点は東北地方太平洋沖地震が最大となった地点を示しています.今回の地震に対応する赤色で示された地点が福島県北部に見られることがわかります.すなわち,福島県の北部では今回の地震の揺れが東北地方太平洋沖地震を上回り,2011年以降で最大の揺れであったことを意味しています.
In order to compare the ground motion level in the 0.5-1.0 s with that of the 2021 earthquake, the spectral ratio of the horizontal motion for each record is taken and the average amplitude factor in the 0.5-1.0 s is shown in the figure. The amplitude north of the northern part of Fukushima prefecture are generally more than twice as large as that of the southern part, while the southern part is less than twice as large as that of the northern part. This suggests that the area north of northern Fukushima prefecture experienced stronger shaking than in the 2021 earthquake. This may be due to the difference in the magnitude of the earthquakes, but there are some points where the theoretical factor is higher than that estimated from the ratio of seismic moments (1.33-2.34), and the period of 0.5-1.0 s may be too short to apply the theoretical factor on the long-period side (2.34).
The earthquakes since 2011, including the 2011 Tohoku Earthquake, were categorized as the earthquakes with the largest ground motions in each site. The acceleration response spectra are compared with the period 0.5-1.0 s average and period 1.0-2.0 s average values, respectively, and are color-coded in the figure. The gray points in the figure indicate the sites where the maximum ground motions were experienced in the 2011 Tohoku earthquake. The red points corresponding to this earthquake can be seen in the northern part of Fukushima prefecture. This means that in the northern part of Fukushima prefecture, the shaking of this earthquake exceeded that of the Tohoku Earthquake, and was the largest since 2011.

謝辞 Acknowledgment
本報告では,気象庁,防災科学技術研究所ならびに港湾地域強震観測の記録を使用致しました.記して感謝致します.
In this report, I used strong ground motion records of JMA, NIED, and PARI. I appreciate for the efforts.
参考文献 References
[1] 気象庁:令和4年3月16日23時36分頃の福島県沖の地震の震源要素更新について.https://www.jma.go.jp/jma/press/2203/17d/oshirase.pdf
[2] 気象庁:CMT解 https://www.data.jma.go.jp/eqev/data/mech/cmt/top.html
[3] 地震調査研究推進本部:2022年3月16日福島県沖の地震の評価.https://www.static.jishin.go.jp/resource/monthly/2022/20220316_fukushima_1.pdf
[4] 気象庁:令和4年3月16日23時36分頃の福島県沖の地震について.https://www.jma.go.jp/jma/press/2203/17a/202203170130.html
[5] 土木学会地震工学委員会 地震被害調査小委員会.https://committees.jsce.or.jp/eec205/
[6] 土木学会地震工学委員会 地震被害調査小委員会:令和4年3月福島県沖の地震に関する被害調査報告会.https://committees.jsce.or.jp/eec2/node/198
[7] 国土交通省:福島県沖を震源とする地震について.https://www.mlit.go.jp/saigai/saigai_220316.html
[8] 福島県:福島県災害対策本部員会議(3月16日震度6強).https://www.pref.fukushima.lg.jp/sec/16025b/honnbuinnkaigi-6kyou.html
文責 後藤浩之 (Hiroyuki Goto)(京都大学防災研究所 DPRI Kyoto University)